Entry · Ref -CCTIM1P
How Traffic Source Monitoring Helps You Understand Your Audience
- Posted
- 2026-10-06
- Last amended
- 2026-10-06
- Account
- @5dry9dn1oq
Why Knowing Where Your Visitors Come From Matters
Every website gets visitors, but not all traffic is created equal. Some people arrive after searching for a specific term on Google. Others click a link shared on social media or follow an ad they saw on another site. Understanding the mix of sources that bring people to your site is where traffic source monitoring becomes valuable. It gives you a clear picture of which channels are performing, which ones need work, and where you should focus your time and budget.
I have worked with small business owners who poured money into Facebook ads without ever checking whether those clicks actually led to sales. They assumed more traffic meant better results. When we finally looked at the data, we found that most of their social media visitors bounced within seconds. The real revenue came from organic search and a handful of referral traffic links from industry blogs. That kind of insight only comes from consistent monitoring.
Breaking Down the Main Traffic Channels
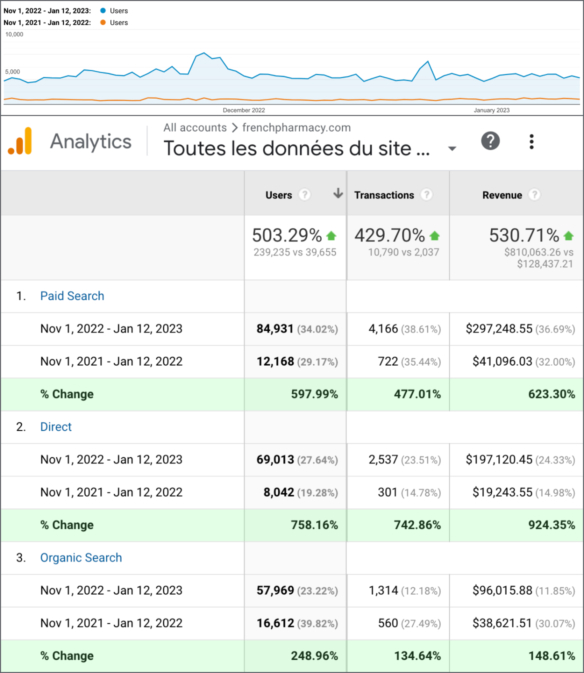
Most web analytics tools, including Google Analytics, organize traffic into a few broad categories. Organic search covers people who found your site through a search engine. Paid ads include any traffic from pay-per-click campaigns. Social media groups clicks from platforms like Facebook, Twitter, and LinkedIn. Referral traffic tracks visitors who clicked a link on another website. Direct traffic accounts for people who typed your URL manually or had it bookmarked. Email campaigns also appear as a separate channel if you tag your links correctly with UTM parameters.
Each channel brings a different type of user behavior. Someone from organic search is often looking for an answer to a specific question. A visitor from a paid ad might be comparing options and ready to buy. People from social media may just be browsing casually. Knowing these differences helps you tailor your landing pages and messaging for each audience.

What the Metrics Actually Tell You
Raw visitor numbers only tell part of the story. You need to look at deeper metrics to judge performance. Bounce rate shows how many people leave after viewing only one page. A high bounce rate from a particular source might mean your ad or link promised something the page did not deliver. Conversion rate measures how many visitors complete a desired action, like signing up for a newsletter or making a purchase. Click-through rate from emails or ads tells you how compelling your offer or headline is to the audience seeing it.
I once consulted for an e-commerce store that had great click-through rates on their Google Ads but very low conversion rates. The ads were well written, so people clicked them. But the landing pages were generic and did not match the ad copy. Visitors landed expecting one thing and found something else. A simple A/B test on the landing page doubled their conversion rate within two weeks. That kind of fix is only possible when you monitor traffic sources and compare the performance of each.
Using UTM Parameters and Real-Time Reporting
If you run multiple campaigns across different platforms, UTM parameters become essential. These are small tags you add to your URLs that tell your analytics tool exactly where each visitor came from. You can track which email campaign drove more traffic, which social post had the highest engagement, or which ad variation produced the best results. Without UTM parameters, all your social media traffic gets lumped into one bucket, and you cannot tell if your LinkedIn efforts are outperforming your Instagram posts.
Real-time reporting helps you see how a new post or ad performs the moment it goes live. If you share a link on Twitter and watch the traffic spike in your analytics dashboard within minutes, you know that platform is responsive for your audience. If nothing happens, you may need to adjust your timing or your message.
Going Beyond Clicks with User Behavior Tools
Numbers alone do not explain why people behave the way they do. That is where tools like heatmaps and session recordings come in. Heatmaps show you where visitors click, scroll, and hover on your pages. Session recordings let you watch a replay of a real user navigating your site. Pairing this data with traffic source monitoring helps you answer questions like: Do people from organic search scroll further down the page than those from paid ads? Are visitors from email campaigns more likely to click the call-to-action button?
Funnel analysis takes this a step further. It maps the steps a visitor takes from the moment they land on your site until they convert. You can see at which stage people drop off and which traffic sources produce the most engaged users. Attribution models then help you decide how much credit each channel deserves for a conversion. Maybe the first click came from a blog post, but the final click before purchase was a branded search. Both played a role, and a good attribution model gives you a fair picture of each channel's contribution.
Practical Steps to Start Monitoring Today
You do not need a huge budget to begin traffic source monitoring. Most of the tools you need are free or have generous free tiers. Here are a few steps that work well for almost any site:
- Set up Google Analytics or another web analytics tool on every page of your site. Make sure the tracking code is installed correctly.
- Add UTM parameters to every external link you share, especially in email campaigns, social media posts, and paid ads. Use a consistent naming convention so you can filter reports later.
- Check your analytics dashboard at least once a week. Look for changes in traffic volume, bounce rate, and conversion rate by source.
- Run a simple A/B test on your highest-traffic landing pages. Change one element at a time, such as the headline or the button color, and measure the impact on conversion rate.
These steps do not require a specialist. With a little practice, anyone can set up the tracking and start drawing insights from the data.
Common Pitfalls to Avoid
One mistake I see often is relying on a single metric. If you only look at total visits, you might think a channel is working when it is actually sending low-quality traffic. Another pitfall is forgetting to tag your links. Without UTM parameters, you lose the ability to compare campaigns directly. Also, avoid making decisions based on very small sample sizes. A spike from one tweet does not mean you should shift your entire budget to social media. Wait until you have enough data to see a pattern.
Another issue is not segmenting your traffic. If you look at your overall bounce rate, you might miss that your blog visitors stay for minutes while your product page visitors leave in seconds. That difference matters. Segment by source and by page type to get a clearer view.
Turning Data into Action
Traffic source monitoring is not just about collecting numbers. The real value comes from using those numbers to make better decisions. If you see that organic search brings visitors with a high conversion rate, invest more in SEO tools and content creation. If paid ads have a high click-through rate but a low conversion rate, revisit your landing pages and ad targeting. If social media drives a lot of traffic but those visitors rarely buy, maybe your social audience needs more nurturing before they are ready to purchase.

Every channel has strengths and weaknesses. The best strategies are built on understanding those trade-offs and adjusting your efforts accordingly. Over time, you build a clearer picture of your audience's preferences and habits, which lets you serve them better and grow your business more efficiently.
In the end, the goal is not just to know where your traffic comes from. It is to understand what each visitor wants and to give them a path to get it. That starts with good monitoring and a willingness to act on what the data shows.